Tumbling, Part One: Some Background
25 Jun 2011 I've talked about Tumblr before, and I've talked about using epidemiology models as an analogue for the spread of 'information' on social networks.And having spent a fair amount of time on Tumblr recently, I have more insights, and more to say on the subject.
Resummarising
First of all, Tumblr is like Twitter in that a post can be spread from person to person by reblogging (similar to retweeting on Twitter). But more importantly, for a normal person like me, you will find that you'll get far more reblogs than you can ever get retweets. And this is important because it gives you more data to work from.
The key here is that you're typically sharing pictures. And in particular, often pictures that fall into certain fandoms - Tumblr is very good at fandoms. So if you post a picture relating to Doctor Who, then it will attract the attention of Doctor Who fans, who may like it and want to reblog it.
An analogy
Imagine there is some air born contagious disease, BUT it only affects men. Women can't even act as carriers.
Now imagine some guy has the disease. In a normal population, you have an approximately even mix of men and woman, so if the disease spreads, it will spread relatively slowly.
But this guy was just on holiday from his all boys boarding school. So when he goes back after the summer - can you see where this is going?
The fact that it's all boys, who are generally in close proximity, means that the disease is likely to spread through the boarding school like wildfire, infecting (almost) every boy.
(There could still be boys that are resistant to the disease, after all.)
Oh, and for completeness, if this infective guy were instead amongst a group of all women, then the disease wouldn't spread at all. But that should go without saying.
Birds of a Feather
If you are a massive Doctor Who fan, and if a huge chunk of what you post on Tumblr is Doctor Who related, then you are going to attract followers that are Doctor Who fans. You're likely to follow other Doctor Who fans yourself.
So it is, that subscribers to a given fandom with tend to cluster together, forming (relatively) tightly knit communities. If you then post a particularly popular ('contagious') image, then it will spread through the fandom like wildfire, as per the analogy.
Obviously, varying degrees of contagiousness still apply; fandom or not, a crappy picture isn't going to get much attention.
And on the other side of the coin, if you were then to post an image relating to a different fandom, which doesn't strongly overlap with Doctor Who, then the post will spread slowly, if at all.
Big Milk Thing
So I posted this image shortly after A Good Man Goes to War aired. When I last checked, it had achieved a respectable 1,431 notes -> 591 likes, and 840 reblogs.
One of the problems with Tumblr is that it doesn't time stamp reblogs. So, unless you're willing to put in the effort to keep track by hand, you can't get good 'spread over time' data.
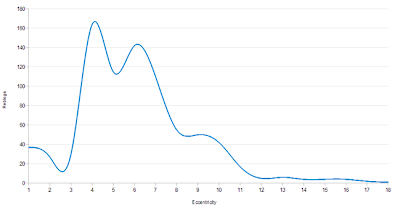
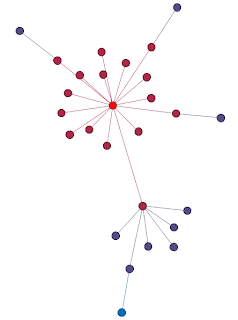
So what I did instead was work with 'spread over eccentricity'. Here's a network graph to help illustrate
The nodes are coloured by their distance (eccentricity) from me, going from red (closest), to blue (furthest away) - I'm the reddest dot, in the middle of the circular cluster near the top.
So what we can do is count how many pople are at each distance from me - equivalent to assuming that eccentricity is time linked. Which it isn't, but it's the best we have.
So here's the graph of that spread
And reassuringly, it bears some similarity to epidemiology graphs - it hits at tipping point at the third generation causing a massive burst of reblogs, then slowly dies out; albeit with a secondary hump after generation 5.
You can actually see why the tipping points happen by the clusters in the network graph - the biggest super-node, matt-smith-, exposed the image to a massive audience of Doctor Who fans.
Similarly in generation 5 with fuckyeahdrwho - the second largest circular cluster - though the effect was smaller, arguably because a large number of people had already seen it at that point.
Bar Graph of My Favorite Pies
For contrast, here's what the network graph looks like for a How I Met Your Mother image I posted
In this case most of the spread is directly from me - as the original poster I act as a de facto super-node, as is the case with most posts. The post also doesn't spread very far this time, and in fact starts to die out straight away - as seen in the graph below.
One could argue that, if the image were found by a HIMYM fan blog, it would have seen a resurgence similar to that for the Dr Who image. But on the other hand, I've had Scrubs images reblogged by fan blogs, and still not seen them spread as much as the Dr Who,
In this case, the image was reblogged by fyscrubs - the bottom 'super-node' - and it still didn't spread very far.
So I think it's fair to say that HIMYM and Scrubs fans are (in general) less 'intense', and less numerous than Doctor Who fans. Or at least so on Tumblr.
[edit] - Shortly after I posted this blog, an image I posted last week - that had garnered very little attention until now - hit a super-node. And as with the Dr Who example, it exploded with likes and reblogs. So that's arguably points against a 'spread over time' approach. If only because it's too unpredictable.
So that's that. In Part 2 and Part 3 of this series, I'll be looking at creating a mathematical model of the information spread discussed here.
Oatzy
[For the record, captioned screencaps aren't the only things I post on Tumblr.]


