Patterns in the Lottery
14 Aug 2010 Back in 2009, Derren Brown once again shocked the world with his witch-craft, as he predicted the lottery, live on TV.Later that week he explained how he did it - wisdom of the crowds. Which is complete and utter bullshit. But it was a magic trick, so what do you expect? If anything, the whole incident was probably an ingenious marketing ploy for "The Events" series of which it was a part. But I digress.
The idea of Wisdom of the Crowd is that if you get a group of people to make a guess at a quantity (say, the number of coffee beans in a jar), then take the average, the average will be surprisingly accurate. It's just an application of the law of large numbers.
But this doesn't work in the case of the lottery, because the lottery is completely random, and taking the average of all the previous numbers would give approximately the same six numbers for every week. Which doesn't happen.
But are there any patterns in lottery numbers?
The answer is, in fact, yes!
NB/ The explanation on this one is going to be sparse because I did all this a while back and didn't have the sense to keep clear notes on what exactly I was doing.
Statistical Analysis
Thanks to the internet, I managed to get hold of all the winning numbers (for the standard UK lottery), which at the time, totaled 1432 sets of numbers.
Plotting the occurrences of each number, you get something like this:
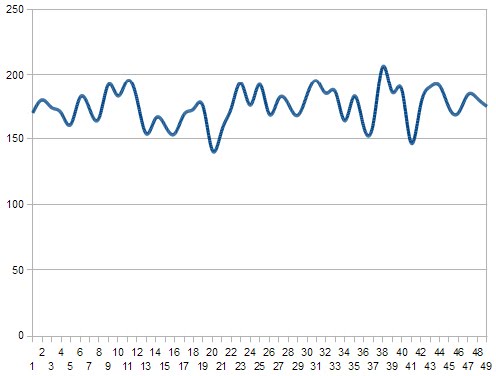
But, obviously, by the law of large numbers, that line should eventually flatten out.
[Incidentally, the one time I did play the lottery after doing all this, I pick 38 as one of the numbers and it came up. Just saying.]
I then put the numbers in numerical order and got the following sets:
Mean - 7, 15, 22, 29, 36, 43
Mode - 1, 9, 23, 31, 38, 49
Median - 6, 14, 22, 29, 37, 45
And if you can draw anything from at, it's that the 'average' set of numbers tend to be relatively evenly spaced. I did some measures of spread, standard deviation, etc., and the results seemed to agree. But that wasn't that interesting.
But what is slightly interesting is what you get when you plot the numbers against what position they appear in, in the ordered sequence:
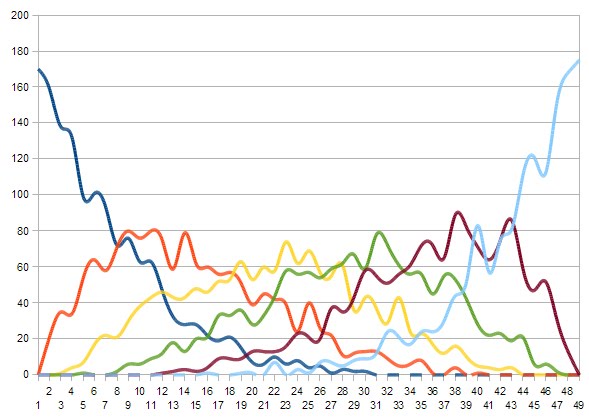

So the pattern there isn't obvious, but the is a definite pattern.
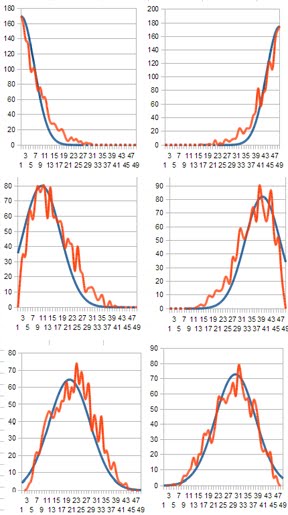
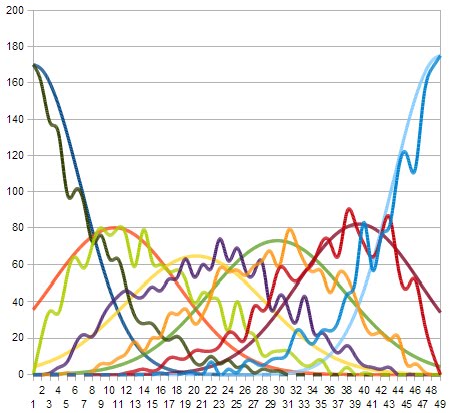
Based on the first plot, I tried fitting the numbers to Gaussian curves, and got something like this:
Combinatorics
The way you work out your odds of winning the lottery is relatively straight-forward - explained here. Have a quick read of that. Can't be bothered to explain myself.
Now, again, I can't remember how I derived this, but the probability of the i-th ball being x (when the balls are put in numerical order) is given by:
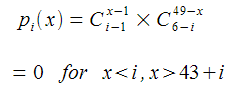


Problem
So say you want to know the probability of a certain (ordered) sequence, you just take the product,
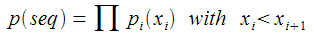
The first (smallest) number is most likely to be 1, the last (largest) is most likely to be 49, etc.
Which does make sense. Say the smallest number is 1, then the other five numbers can be anything (except 1). If, on the other hand, the smallest number is 44, then the other numbers can only be {45, 46, 47, 48, 49}. So obviously, a sequence starting with 1 is massively more likely than a sequence starting with 44.
But that then seems to imply that there is a most likely sequence {1, 11, 20, 30, 39, 49}. And running the numbers, you find that that sequence is much more likely than {1, 2, 3, 4, 5, 6}.
It's been a favourite of the mathematicians that all sequences of lottery numbers are equally likely (supported by calculation) - that {1, 2, 3, 4, 5, 6} is just as likely as, say, {4, 12, 23, 33, 39, 48}.
So here's my challenge to you - spot the hole in my ordered probability calculation.
Or is there a hole? What is actually going on here?
Oatzy.